Why Your Website Speed is Killing Your Conversions (And How to Fix It)
A 1-second delay in page load time can drop conversions by 7%. Here's a deep dive into the performance metrics that matter and how modern frameworks solve them.

You've spent months building a beautiful website. The design is sharp, the copy is dialed in, and the brand is on point.
But your bounce rate is 65% and conversions are flat.
The problem isn't your design — it's your speed.
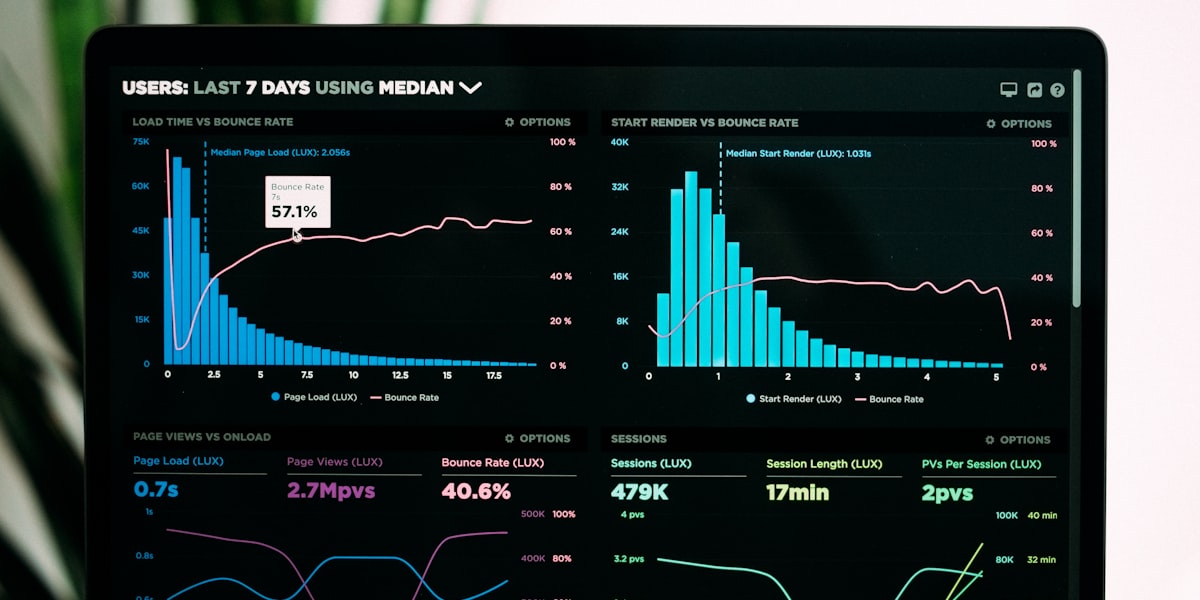
The Numbers Don't Lie
Google's research is unambiguous:
- 53% of mobile users abandon a page that takes more than 3 seconds to load.
- A 1-second delay in load time reduces conversions by 7%.
- Pages that load in 2.4 seconds have a 1.9% conversion rate — at 4.2 seconds, it drops to under 1%.
And it gets worse. Google's Core Web Vitals are now a direct ranking factor. Slow websites don't just lose visitors — they lose search visibility too.
That means fewer people even find your site in the first place.
The Three Metrics That Matter
Google's Core Web Vitals boil down to three numbers. Understanding them is the first step to fixing them.
Largest Contentful Paint (LCP)
This measures how long it takes for the main content to appear on screen. Target: under 2.5 seconds.
Common culprits for poor LCP include unoptimized hero images (serving 4MB PNGs instead of compressed WebP), render-blocking JavaScript that delays content painting, and slow server response times from shared hosting.
Cumulative Layout Shift (CLS)
This measures visual stability — how much the page jumps around while loading. Target: under 0.1.
The biggest offenders are images without explicit width/height dimensions, dynamically injected ads or banners, and fonts that swap and cause text reflow. Nothing frustrates a user more than clicking a button just as the page shifts and they hit something else.
Interaction to Next Paint (INP)
This replaced First Input Delay in 2024 and measures overall responsiveness. Target: under 200ms.
Poor INP usually comes from heavy JavaScript execution blocking the main thread, poorly optimized event handlers, and third-party scripts like analytics, chat widgets, and marketing pixels.
The Modern Stack Solution
At Quessence, every website we build is optimized for performance from the ground up. Here's how:
Server-Side Rendering + Static Generation
We use Next.js with a hybrid approach. Static pages where possible, server-rendered pages where dynamic data is needed.
This means your HTML is ready before the browser even starts parsing JavaScript. The user sees content immediately, not a blank white screen.
Image Optimization Pipeline
Every image goes through automatic optimization:
- Format conversion — WebP or AVIF depending on browser support.
- Responsive sizing — Multiple sizes served based on viewport width.
- Lazy loading — Images below the fold load on scroll, not on page load.
- Blur placeholders — A tiny blurred preview shows instantly while the full image loads.
Edge Deployment
Websites deployed to edge networks (Vercel, Cloudflare) serve content from the closest server to each visitor.
A user in Mumbai gets served from Mumbai — not Virginia. That alone can shave 200–400ms off every page load.
Code Splitting and Tree Shaking
Only the JavaScript needed for the current page is loaded. A 500KB bundle becomes five 100KB chunks, loaded on demand.
Your homepage doesn't need to download the code for your contact form until the user navigates there.
The Business Impact
When we rebuilt a client's e-commerce site with these optimizations, the results were immediate:
- LCP dropped from 4.1s to 1.8s
- Bounce rate decreased by 31%
- Conversion rate increased by 22%
- Google search impressions grew 40% in 8 weeks
Performance isn't a nice-to-have — it's a revenue lever.

Quick Wins You Can Implement Today
If a full rebuild isn't in the cards right now, here are five improvements you can make this week:
-
Compress all images — Use Squoosh or ImageOptim to convert to WebP. This alone can cut page weight by 50%.
-
Add explicit dimensions to every image tag to prevent layout shift. Set width and height attributes on every
<img>. -
Defer non-critical JavaScript — Move analytics, chat widgets, and marketing pixels to load after page content renders.
-
Enable caching headers — Set proper
Cache-Controlheaders for static assets so returning visitors load instantly. -
Use a CDN — Even a free Cloudflare plan dramatically improves global load times by serving assets from edge locations.
Start with images. That's where most sites lose the most performance for the least effort.
Is your website leaving money on the table? Let's audit your performance and build something faster.